Read your first report
Home is all you need for the first week. This page walks its seven cards, defines the base vocabulary precisely — user, session, engaged session, key event — and says which reports the date-range chip actually applies to.
Home at a glance#
Home has seven cards, and their order is not accidental: it starts at "how many people", moves to "where they came from", and ends at "what they did".
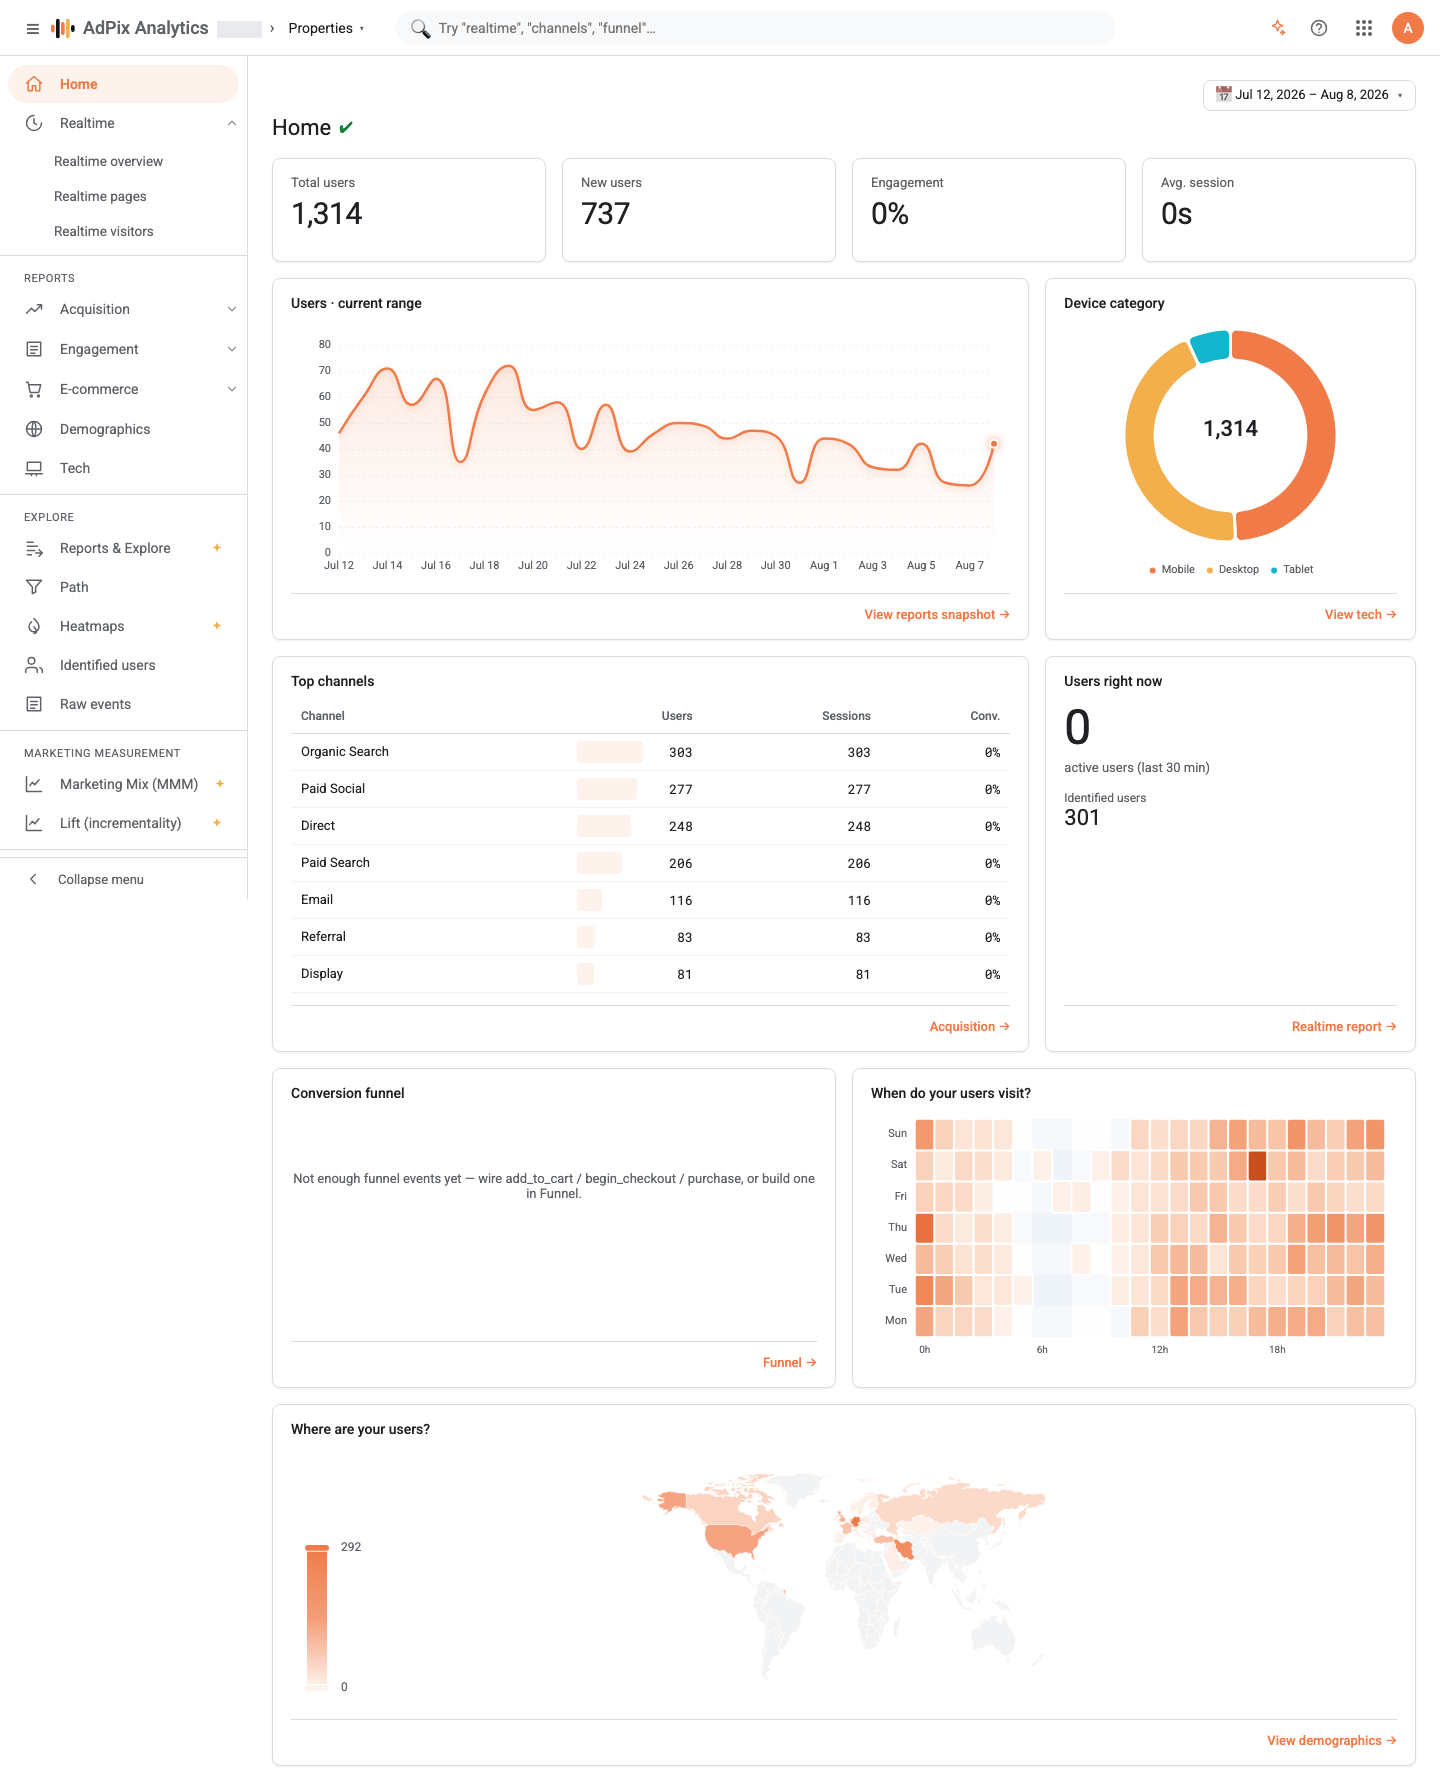
| Card | What it shows |
|---|---|
| Users · current range | Four headline metrics — total users, new users, engagement, average session — plus the daily users trend. |
| Device category | The share of users on mobile, desktop and tablet. |
| Top channels | Users, sessions and conversion rate by channel. |
| Conversion funnel | A preview of the default funnel: page view → session start → add to cart → begin checkout → purchase. |
| When do your users visit? | A weekday-by-hour heatmap. |
| Users right now | Active users in the last 30 minutes, plus the number of identified users. |
| Where are your users? | A world map of users by country. |
Each card carries a link to its full report at the bottom — Top channels to Acquisition, the funnel to the Funnel report, Users right now to Realtime.
The base vocabulary#
These five words mean the same thing in every report. Get them precise and no AdPix report will surprise you.
Users. The number of unique visitors in the selected window. It is based on the visitor identity held in the browser, so one person on two devices counts as two users until they are identified.
New users. Visitors whose first ever visit falls inside this window. The tracker sends a first_visit event at that moment and the count comes from it — which is why this number can never exceed total users.
Sessions. A session begins with activity and closes after 30 minutes of inactivity. Coming back half an hour later is a new session; it is still the same user.
Engaged session. A session that meets at least one of three conditions: at least 10 seconds of active engagement, at least 2 page views, or at least one key event. That definition is what Traffic acquisition and Engagement use.
Key events. The events you marked yourself under Admin → Key events — a sign-up, a form submit, a purchase. The Conv. column on the Top channels card is those events over that channel's sessions.
If you skipped the Objectives step during setup and never defined key events afterwards, the conversion column reads zero on every channel — not because nobody converted, but because no event is marked as key. Fix it under Admin → Key events.
Engagement on Home is not the engagement rate in reports#
The Engagement metric on Home is simple: 100 minus the bounce rate, where a bounce is a session with no more than one page view.
Traffic acquisition is stricter and uses the engaged-session definition, which also counts engagement time and key events. The two numbers differing slightly is expected. Use the Traffic acquisition figure to compare channels; the Home metric is there to show direction.
Average session comes from real engagement time#
This difference matters enough to state separately.
AdPix does not derive session length from the gap between the first and last event. The timestamp on an event is the moment the collector received it, and the tracker sends events in batches; with that method the min-to-max difference of a session collapses towards zero and the number becomes meaningless.
Instead the tracker measures active engagement itself and sends it in props.engagement_time_msec. AdPix sums those values per session and then averages them. The result is what Google Analytics 4 reports and is directly comparable with it.
The date-range chip#
Above the reports sits a date-range chip that applies to every historical report, not only the one on screen.
- The default is Last 30 days. The rest: Today, Yesterday, Last 7, 28, 30 and 90 days, This week, Last week, This month, Last month, This year, and a custom range.
- Your choice is remembered in the browser, so it survives moving to the next report.
- The Compare switch adds a second window: previous period, previous period matching the day of week, previous year, or custom.
Until you turn Compare on, no percentage change is shown next to the metrics and the chart carries no comparison line. That is deliberate — a comparison nobody asked for raises more questions than it answers.
Remember the two exceptions: realtime screens have their own window and do not show the date picker at all, and the Users right now card on Home always counts the last 30 minutes.
Day boundaries follow the property time zone#
"Today", "yesterday" and every hourly bucket are evaluated in the property's time zone, not your browser clock. A colleague in another time zone opening the same report sees exactly the same numbers. View or change the zone under Admin → Property details.
Where to go after Home#
Depending on the question you have:
- "Where does my traffic come from?" → Acquisition overview and Traffic acquisition.
- "What do people do once they arrive?" → Engagement, Events and Path.
- "Where do I lose people on the way to a purchase?" → Funnel.
- "What is happening right now?" → Realtime overview.
If the numbers do not match your previous tool exactly, that is normal and the reasons are explainable; they are in the numbers don't match GA4.
Frequently asked questions#
Why can New users never exceed Total users?
Because both are counted over the same population. New users is the number of visitors whose first ever visit falls inside the window - the first_visit event - and they are a subset of that window's users. If you ever see new users above total users, that figure came from somewhere else and is wrong.
What exactly is Engagement on Home?
On Home, Engagement is 100 minus the bounce rate, and a bounce is a session with no more than one page view. It is not the same as the engagement rate in Traffic acquisition, where an engaged session has a stricter definition that also counts engagement time and key events.
How is average session calculated?
From the real engagement time the tracker measures and sends in props.engagement_time_msec; those values are summed per session and then averaged. It is not derived from the first and last row timestamps, because event time is server receipt and batched delivery makes that difference meaningless. That is why the figure is comparable with Google Analytics 4.
Does the date-range chip apply to Realtime?
No. Realtime screens take their window from the 5, 30 and 60 minute chips, and the date picker is not shown there at all. The Users right now card on Home also always counts the last 30 minutes, not the selected range.
Thanks — your feedback helps us improve the docs.