Realtime overview
The Realtime report exists to answer one question: what is happening right now? Do not read it as a smaller version of the dated reports — its window rolls, it carries no session metrics, and it shows traffic source exactly as it was stamped at collection time.
What Realtime is for#
Realtime is a confirmation tool, not an analysis tool. The questions it genuinely answers are:
- I just installed or changed the tag — is it working?
- I defined a new event — does it actually fire, and does it arrive under the name I expect?
- We switched a campaign on a few minutes ago — is its traffic landing?
- Is the site back up, or can nobody reach it yet?
Questions you should not bring here: bounce rate, session duration, conversion by channel, comparison with last week. None of those exist in Realtime, and reading this screen with a dated report's expectations only creates confusion.
| Your question | The right screen |
|---|---|
| How many people are on the site right now, and where from? | Realtime overview (this page) |
| Which pages are open right now? | Realtime pages |
| What exactly are those people doing? | Realtime visitors |
| How did this month go? | The dated reports — start at Home |
The live window#
Three buttons sit at the top of the page: 5 min, 30 min and 60 min. The default is 30 minutes — the same window the "Users right now" card on Home uses.
The window rolls: every time the page fetches fresh data, the range is measured backwards from the current moment. The page refreshes itself every five seconds, so there is nothing to reload by hand.
That is also why the date selector does not appear on the realtime screens; there is no calendar range here to pick.
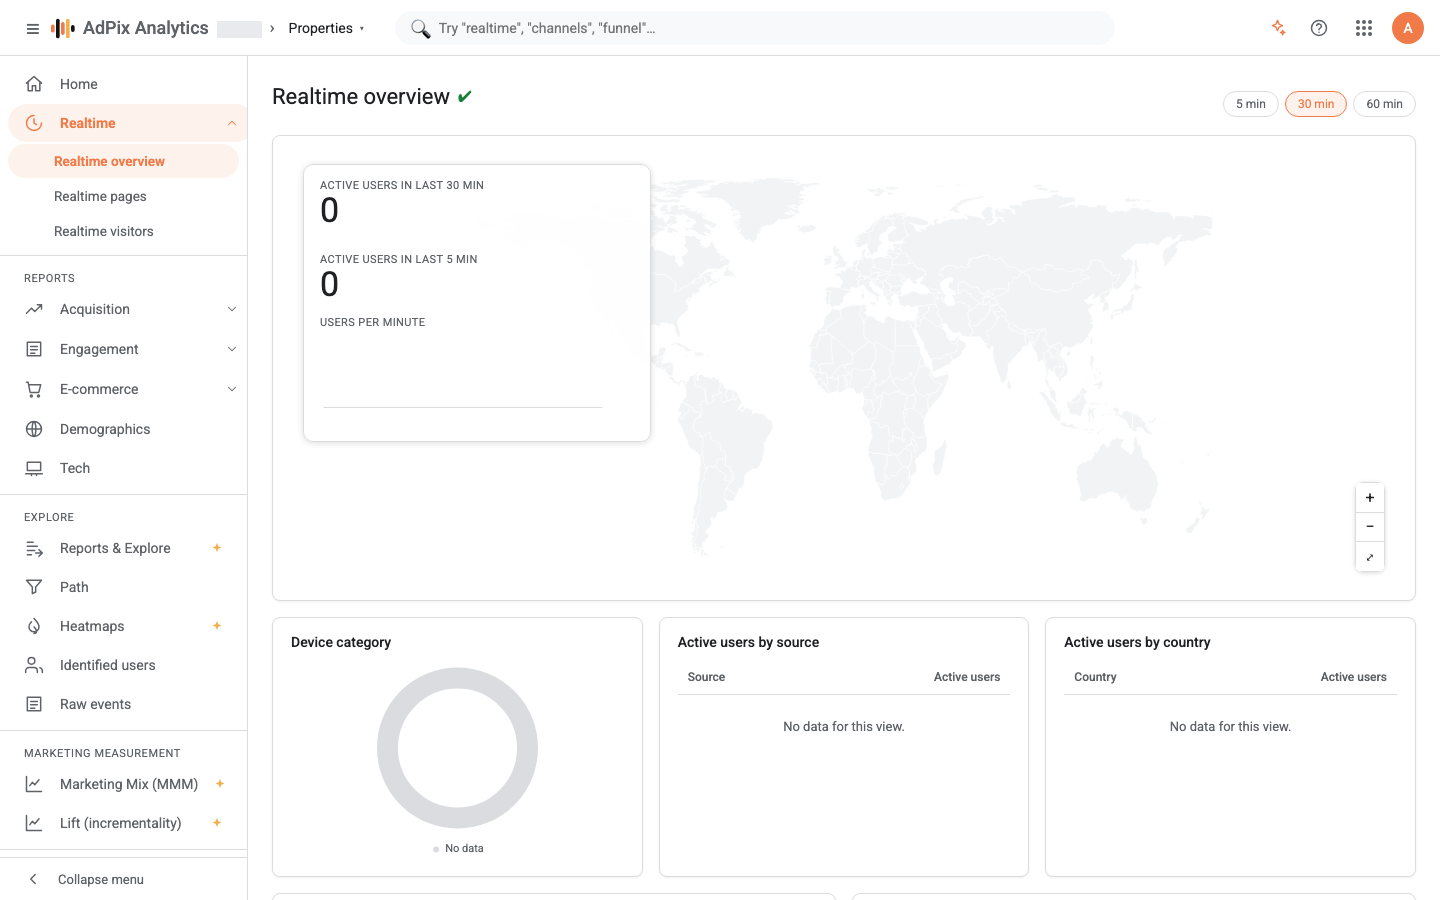
The cards#
The live map sits at the top and carries three things at once: city bubbles for active visitors on a world map, the count of "Active users in last {window} min" beside "Active users in last 5 min", and a "Users per minute" bar strip for reading the pulse of your traffic. The five-minute figure is fixed and does not follow the window buttons. The controls beside the map zoom in and out, and "Reset view" returns to the original framing; whatever you pan or zoom to survives the next refresh.
The rest:
| Card | Columns | Row cap |
|---|---|---|
| Device category | A donut of active users across desktop / mobile / tablet | — |
| Active users by source | Source, Active users | 10 |
| Active users by page | Page, Views | 10 |
| Event count by event name | Event, Count | 10 |
| Active users by country | Country, Active users | 250 |
Traffic with no recognised source appears in the source table as "(direct)". The map draws up to 200 city points, and visitors whose city is unknown sit on their country's centre.
That card's title is about active users, but its numeric column counts page views. If you want active users and views side by side per page, go to Realtime pages, which carries both columns.
How realtime numbers are counted#
- Active users is the count of unique anonymous IDs that sent at least one event inside the window.
- Views counts page-view events only, not every event that happened on the page. That filter is deliberate: without it every scroll and click also counted as a "view" and the figure ran several times high.
- Event count is counted on the event's unique ID, not on rows. The tracker delivers at least once and may resend an event; counting uniquely cancels that repeat out.
- Test traffic is excluded from every card.
Five differences from the dated reports#
This table is where most of the misreading happens.
| Subject | Realtime | Dated report |
|---|---|---|
| Range | A rolling 5 / 30 / 60-minute window against the present moment | The calendar range you selected |
| Comparison | None | Comparison with a previous period, when you switch it on |
| Source and channel | The value stamped on the event at collection time | Recomputed at read time from your current channel rules |
| Session metrics | None — no bounce rate, no session duration, no sessions per user | All of them |
| Timezone | Does not arise; the window is relative to "now" | Every day and hour bucket is evaluated in the property's timezone |
The practical consequence of the third row: change your channel rules and the dated reports immediately reclassify all of history under the new definition, while the source table here keeps showing what was stamped at collection time. To judge the effect of a channel-rule change, use the acquisition report, not this screen.
When everything reads zero#
page_view, your enhanced measurement or custom events are not firing.This screen only works while you have it open. If you want to be told when traffic drops or the event stream stops, define an alert for it; watching Realtime is not a monitoring strategy.
Frequently asked questions#
Why don't realtime numbers match the acquisition report over the same period?
Because they count different things. Realtime is a window that rolls against "right now" and reads source as it was stamped at collection time; the dated reports work on a calendar range in the property's timezone and recompute the channel from your current rules at read time.
Why is there no date selector on the realtime pages?
Because these pages have no calendar range. Their window is always measured back from the current moment and is chosen from 5, 30 or 60 minutes, so a date selector would mean nothing here and is deliberately hidden.
How long until an event I just fired shows up here?
About one refresh cycle. The page re-queries every five seconds, and the tracker itself sends events in batches. If nothing appears after a couple of cycles, the event never reached the server.
Does "Active users in last 5 min" change when I switch the window?
No. That figure always covers the last five minutes, whether you picked 5, 30 or 60. It is the number above it that follows your choice.
Thanks — your feedback helps us improve the docs.