
Audience overlap
Pick two or three saved audiences and see exactly how they intersect: every region of the diagram is labelled with its own count, the pairwise table shows how much each pair shares, and any region can be saved as a new audience.
What this screen is for#
Every audience has its own size, and you can read those anywhere. What no single number tells you is how the groups relate: are your cart abandoners mostly mobile visitors? Do two paid channels reach the same people? Is the "high-value" audience really different from "purchasers"?
Audience overlap, at /audiences/overlap, answers that for two or three audiences at once. Open it from Overlap report on the audiences list, or Overlap on an audience's own page. The old address /overlap forwards here.
Run the comparison#
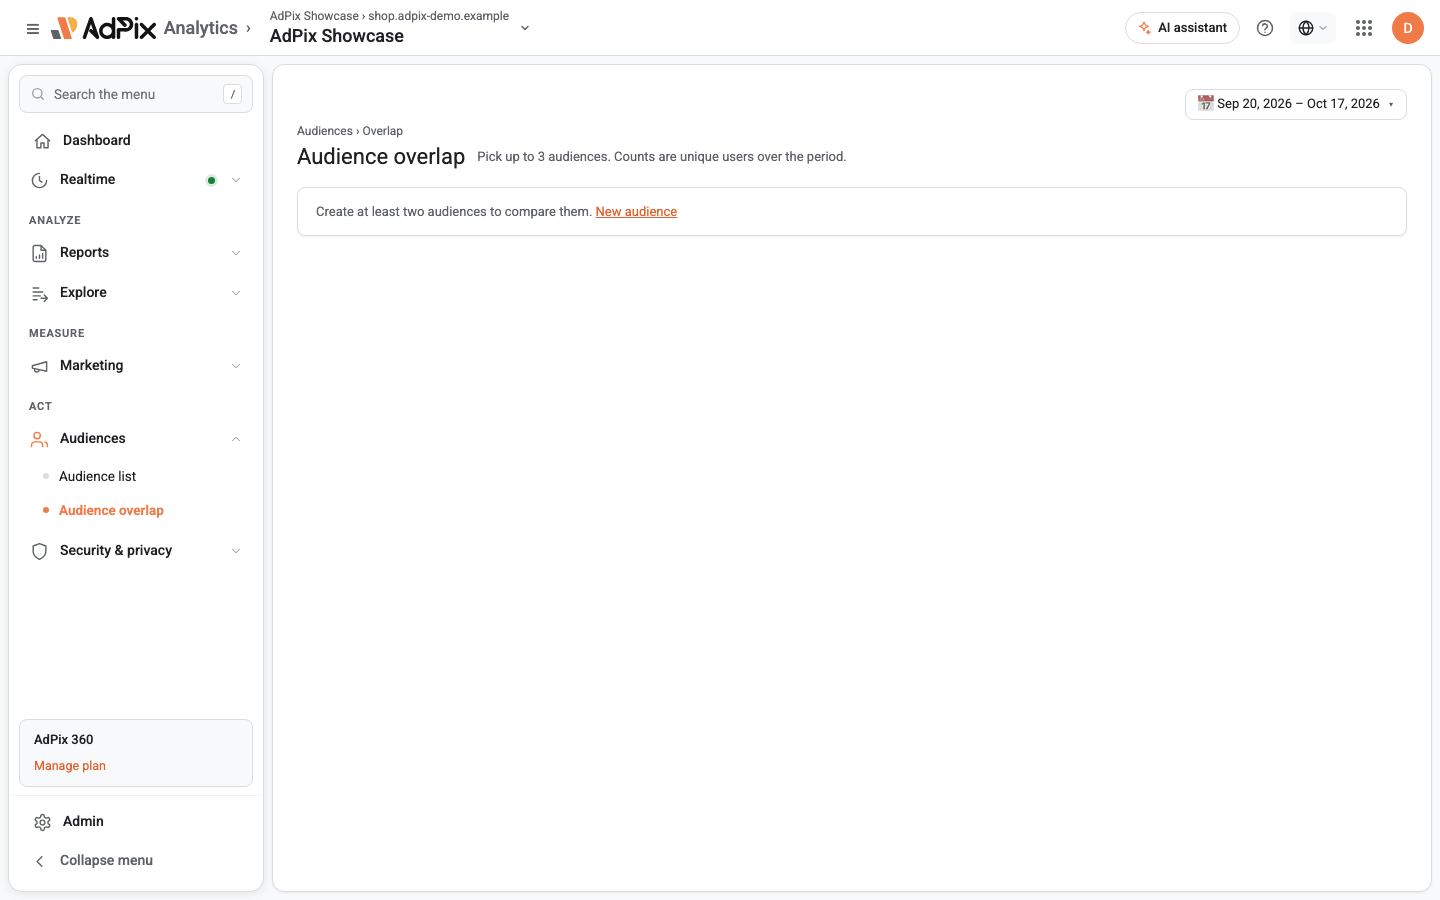
The address keeps your selection (?ids=), so a link to the page opens the same comparison.
Reading the diagram#
The circles are drawn with areas proportional to size, and their positions reflect how much they share, so a small circle sitting inside a large one really is (nearly) a subset.
Every region carries its own number, and the numbers are exclusive: "only A" is people in A and in no other selected audience; the region where A and B meet (without C) is people in exactly those two; the centre is people in all three. With three audiences there are seven regions, and all seven are shown — a zero is shown as zero, never hidden.
Above the diagram:
| Figure | Meaning |
|---|---|
| Users in any | people in at least one of the selected audiences |
| Shared by all | people in every selected audience |
| Only A / only B / only C | people in that audience and no other selected one |
A short sentence under the figures puts the biggest relationship in words — for example, that most of one audience also sits in another.
The pairwise table#
For every pair the table lists:
| Column | Meaning |
|---|---|
| Shared | people in both audiences |
| % of A / % of B | the shared people as a share of each audience |
| Similarity | Jaccard: shared people divided by people in either |
The two percentages are what you read to decide containment: "90 % of B is in A" but "10 % of A is in B" means B is mostly a slice of A.
Act on a region#
Any region can become an audience. Act on a region opens the builder with the region already expressed as rules — "member of A, not a member of B", for instance — so you can save it, push it to a destination, or add it as a comparison on your reports.
What is counted#
- The unit is the person, the same user key audiences use: a signed-in person who used several devices counts once.
- Only members active in the selected range are counted — people who have at least one event on the website between the start and end of the date picker, evaluated in the website's time zone.
- Membership is each audience's latest refreshed membership — the same set a comparison or a push uses.
- Test-mode traffic is never counted.
Frequently asked questions#
Why are the numbers inside the diagram smaller than each audience's size?
Because every region is exclusive. The region for "only A" holds the people in A and in neither of the others; the middle region holds the people in all of them. Add up every region that lies inside A's circle and you get A's size.
Why does an audience show fewer users here than on the audiences list?
This report follows the date picker: it only counts members who were active on the website in the selected range. The list shows the whole current membership. Widen the range and the two converge.
Can I still compare segments here?
No. Overlap now compares saved audiences. The old Segment overlap address, /overlap, forwards to /audiences/overlap. Anything you used to express as a segment can be built as an audience, including session and event scope.
How is the similarity score calculated?
The pairwise table's Jaccard similarity is the people both audiences share divided by the people in either. Zero means nothing is shared; one hundred percent means the two are the same set. Unlike the raw shared count it is not skewed by audience size.
Thanks — your feedback helps us improve the docs.