Run a marketing mix model
A marketing mix model estimates how many conversions each paid channel actually caused — not how many it happened to be the last click on. This page covers the data it needs before it can run, how to start a run, and how to read the output.
The question this tool answers#
Attribution reports tell you which touch came before a conversion. That is a correlational question, and it systematically over-credits harvesting channels — brand search, retargeting — because they pick up demand that already existed.
A marketing mix model asks a different question: if we switched this channel off, how many conversions would we actually lose? To answer it, the model puts about two years of weekly per-channel spend next to the conversions of those same weeks and next to your own site's organic and direct demand, then separates each channel's share from the background. The output is never a bare number: every estimate carries a 95% interval, and the width of that interval is a large part of the product.
Marketing Mix (MMM) is not in the Free plan. If the property is on Free you get an upgrade screen instead of the page, with an Upgrade plan button. The docs are not wrong — the current property's plan does not include the feature. Plans are set per property, so one of your properties can have this page while another does not.
Before you run: the data the model needs#
The model lives at /marketing-mix and is fed from three sources. You supply the first two; the third is automatic.
| Input | Where it comes from | Without it |
|---|---|---|
| Weekly spend per channel | The Cost & ROAS screen (ad-spend import) | there are no channels to model and the run has nothing to say |
| Conversions or revenue | The property's purchase events, with the value parameter for a revenue target |
the run fails — there is nothing to explain |
| Organic and direct demand | Your own site's sessions, automatically | the model has no control and credits paid channels for demand that was already there |
Three quantitative conditions decide what you get back:
- History. Below 78 weeks the model is not fitted at all: the run closes on the INSUFFICIENT tier and no ROI number is shown. The top tier needs 104 weeks — two years.
- Spend variation. A channel that spends roughly the same amount every week cannot have its effect separated out. A weekly-spend coefficient of variation below 0.30 marks it Not identified.
- Collinearity. When several channels' budgets rise and fall together, the data cannot tell their contributions apart. A VIF above 5 earns the same badge.
The model sums the cost column exactly as imported; it does not convert between currencies. Import some channels in rial and others in dollars and the channels' scales no longer compare — both ROIs come out wrong. Pick one currency and import everything in it.
Start a run#
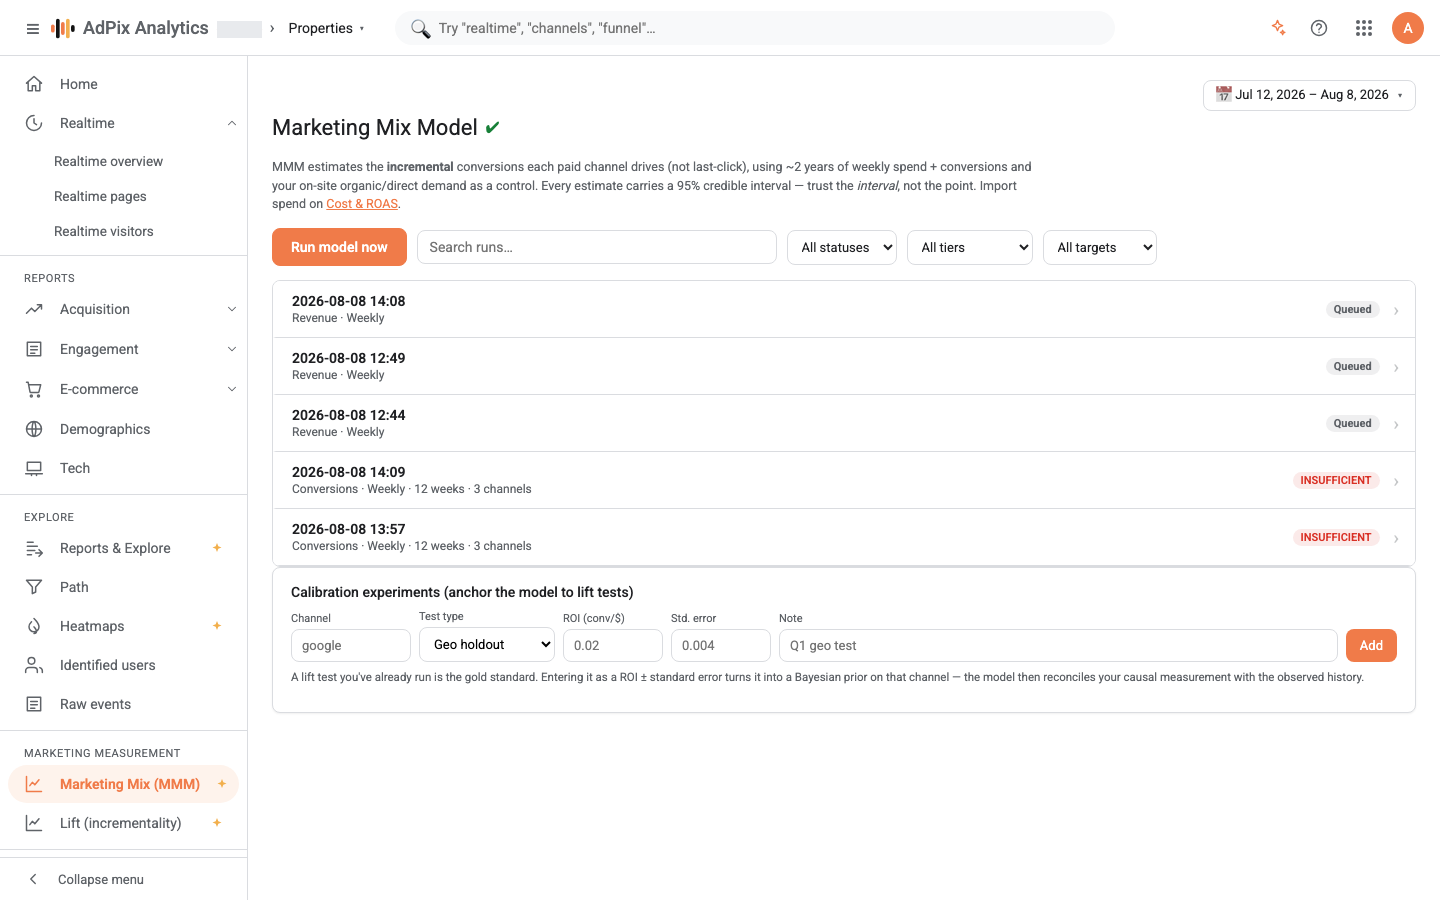
Each row in the list is one run: its date, target, cadence, week and channel counts, and — at the trailing edge — either a lifecycle pill (Queued, Running, Failed) or the finished run's trust tier. Search and three filters sit above the list, and runs still in flight always sort to the top.
How long it takes#
Fitting happens in the background and usually takes a few minutes. Runs are processed one at a time in order, so yours may sit behind another property's run; the queue is polled every thirty seconds. You do not have to keep the page open — the result will be in the list later.
Once a day AdPix also queues a weekly run itself for every property that has imported ad spend and has had no run in the last 7 days. That is where a run you did not start comes from.
How to read the output#
Select any finished run to open the result drawer. Read the cards in the order they appear.
The trust tier comes before the numbers#
At the top of the drawer sits the run's Trust tier with a one-line verdict. This label has the first word. Skip it and you may act on a number the model itself will not stand behind.
| Tier | What it means | What to do with it |
|---|---|---|
| TRUSTED | at least 104 weeks of history, at least half the channels Identified, and a baseline share inside the sane band (between 45% and 92%) | you can move budget on the intervals |
| DIRECTIONAL | the model fits, but the data is thin or channels overlap | trust the ranking of channels, not any single number |
| INSUFFICIENT | the data does not permit a claim | no ROI is shown at all, and the optimizer is closed |
INSUFFICIENT is a deliberate product decision: instead of a number nobody can defend, you get the Not enough data to model yet card, which says exactly what is missing.
ROI and marginal ROI#
The Channel ROI & marginal ROI (95% credible interval) table has these columns:
| Column | Definition |
|---|---|
| Confidence | that channel's Identified / Uncertain / Not identified badge |
| Incr. conv. | the conversions the model attributes to the channel across the modelled period |
| Share | that channel's share of total conversions |
| ROI /$1k | incremental conversions per thousand of spend, with its 95% interval |
| mROI /$1k | the return on the next thousand at today's spend level, with its 95% interval |
| CPA | cost per incremental conversion |
| Spend | the channel's total spend across the modelled period |
The gap between ROI and mROI is where most decisions are actually made. ROI averages everything spent so far; mROI says what the next thousand buys. Because the response curve saturates, a channel can have a high ROI and a low mROI — it has served you well but has little room left. Move budget on mROI, not on ROI.
A channel badged Not identified gets no ROI at all and shows a dash. That silence is also deliberate: the data cannot separate that channel from the others, so any number would mislead. Hover the badge to see the reason.
Read the 95% interval correctly#
Under each estimate a small bar shows the interval, its ends being the bottom and top of the 95% credible interval (HDI in statistical writing). This is the single most misread thing on the page:
- A narrow interval means the data has pinned the number down. "2.0 to 2.4" means you can plan on 2.2.
- A wide interval means there is not enough signal — not that the effect is zero. "1.0 to 9.0" does not say the channel is useless; it says we do not yet know how useful it is.
- You may only conclude that a channel has no effect when the interval is both narrow and sitting around zero.
If you compare two channels by their point estimates while their intervals overlap almost entirely, the comparison carries no information — the data cannot say which is better. Do not move budget on it. Either keep importing spend so the history grows, or anchor the model with a lift test.
The conversion decomposition#
The What drove conversions (baseline vs. paid channels) chart splits every week into layers: the bottom layer is the baseline — organic and direct demand, trend and seasonality — and each layer above it is one paid channel's incremental contribution. The dashed line is that week's actual conversions.
The number to look for here is the baseline share. If the baseline carries most of your conversions, most of your sales would have happened without advertising. That is not bad news, but it is the ceiling on what advertising can do for you.
The response curve#
The Response curve (diminishing returns) chart shows, per channel, what happens to incremental conversions as weekly spend moves up and down. Three markers matter:
- The vertical now line is where the channel sits today.
- The grey zone is beyond the highest spend you have ever actually run. There the model is extrapolating, and its word is worth less.
- The band around the curve is the same 95% interval.
If the curve is still climbing at now, there is room for more spend. If it has flattened, more money is mostly wasted.
Model health and data sufficiency#
The last two cards are for deciding whether to believe the numbers:
- Model health — R² (fit), MAPE, Holdout MAPE (error on weeks the model never saw), R-hat (max) and ESS (min) for convergence, and the Baseline share. If R-hat is not near 1 you get a check convergence note. The chart beneath puts actual conversions against the model's 95% band; the actuals should mostly sit inside it.
- Data sufficiency — per channel: Spend CV, VIF, Spend levels, and the reason behind every badge. This table tells you exactly what has to change for a channel to become Identified.
The budget optimizer#
The Budget optimizer card uses those same response curves to propose how to split a weekly budget across channels. It has two objectives: Maximize conversions for a fixed budget, or Hit a target CPA. The output is each channel's current and recommended spend and the difference, plus predicted conversions with a 95% interval.
On an INSUFFICIENT run the optimizer deliberately refuses and returns This run isn't trustworthy enough to optimize.
Anchor the model with a lift test#
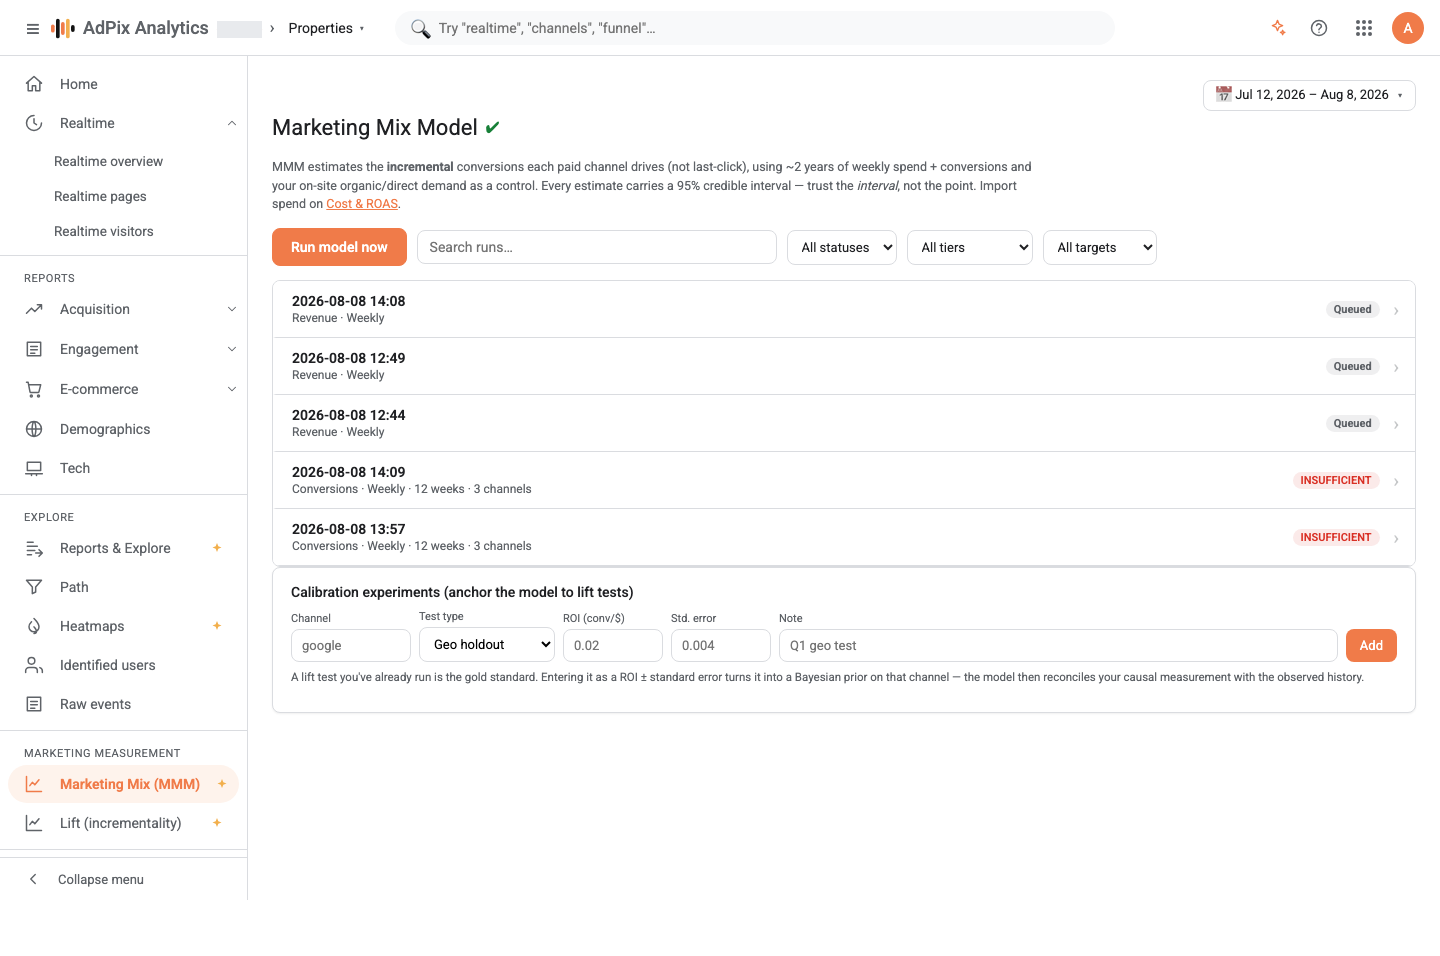
At the bottom of the page sits Calibration experiments (anchor the model to lift tests). If you have run a real experiment — a geo holdout, a budget holdout, PSA/ghost ads — enter its result as an ROI plus a standard error here. The next model run uses it as a prior on that channel.
This is the fastest way out of the DIRECTIONAL tier: instead of waiting to accumulate two years of history, you attach a real causal measurement to an observational model. Running a lift test is where that number comes from.
Exports#
On any finished run that is not INSUFFICIENT, the Export menu offers three things: PDF report (a printable version of the drawer), CSV data (one row per channel with ROI and its intervals) and PNG chart. If your role may not see cost, the cost columns are absent from the CSV entirely — they are not blanked, they simply do not appear.
Frequently asked questions#
Why won't the model run even though I have data?
Below 78 weeks of history the model is not fitted at all — the run closes on the INSUFFICIENT tier. If your history is long enough and the run still fails, either no channel spend has been imported or the property has no purchase events to explain.
Does a wide interval mean the channel's effect is zero?
No. A wide interval means the data cannot pin the number down yet. You can only say a channel has no effect when the interval is both narrow and clustered near zero. An interval of 1.0 to 9.0 says "we don't know", not "it's zero".
What is the difference between ROI and marginal ROI?
ROI is the average return over everything that channel has spent in the modelled period; mROI is the return on the next thousand of spend at today's level. Because the response curve saturates, always move budget on mROI, never on ROI.
How often should I run the model?
You don't have to run it by hand. Once a day AdPix queues a weekly run for every property that has imported ad spend and no run in the last 7 days. Run it manually when you have just imported a backlog of spend.
Thanks — your feedback helps us improve the docs.