The Events report
The Events report tells you what happened on your site over the selected range — each event by name, how many times, for how many users, and how much revenue it carried. Counting is done on each event's unique ID, so a re-sent event is not counted twice.
What this report actually shows#
Events has exactly one dimension: the event name. Each row is a name with four numbers beside it, the same four numbers appear as cards above the table for the whole range, and between them a trend chart shows how each event's share moved over time.
The range comes from the date picker at the top of the screen and defaults to the last 30 days. The range bounds and the day and month buckets are evaluated in the property's time zone, not your browser's — so "yesterday" means your business's yesterday.
The four columns#
| Column | How it is computed |
|---|---|
| Event count | The number of unique event IDs. An event that arrived twice because of a retry is counted once. |
| Total users | The number of unique visitor IDs that fired that event. |
| Event count per active user | The two columns above divided, to two decimals. |
| Total revenue | The sum of the value parameter on those events. |
One thing to know about Total users: the basis is the ID the tracker mints per browser, not the person's resolved identity. Someone who fired the same event on a phone and a laptop is two users in this column. The conversion funnel works the other way round and groups on resolved identity — that is why the two reports do not agree on user counts.
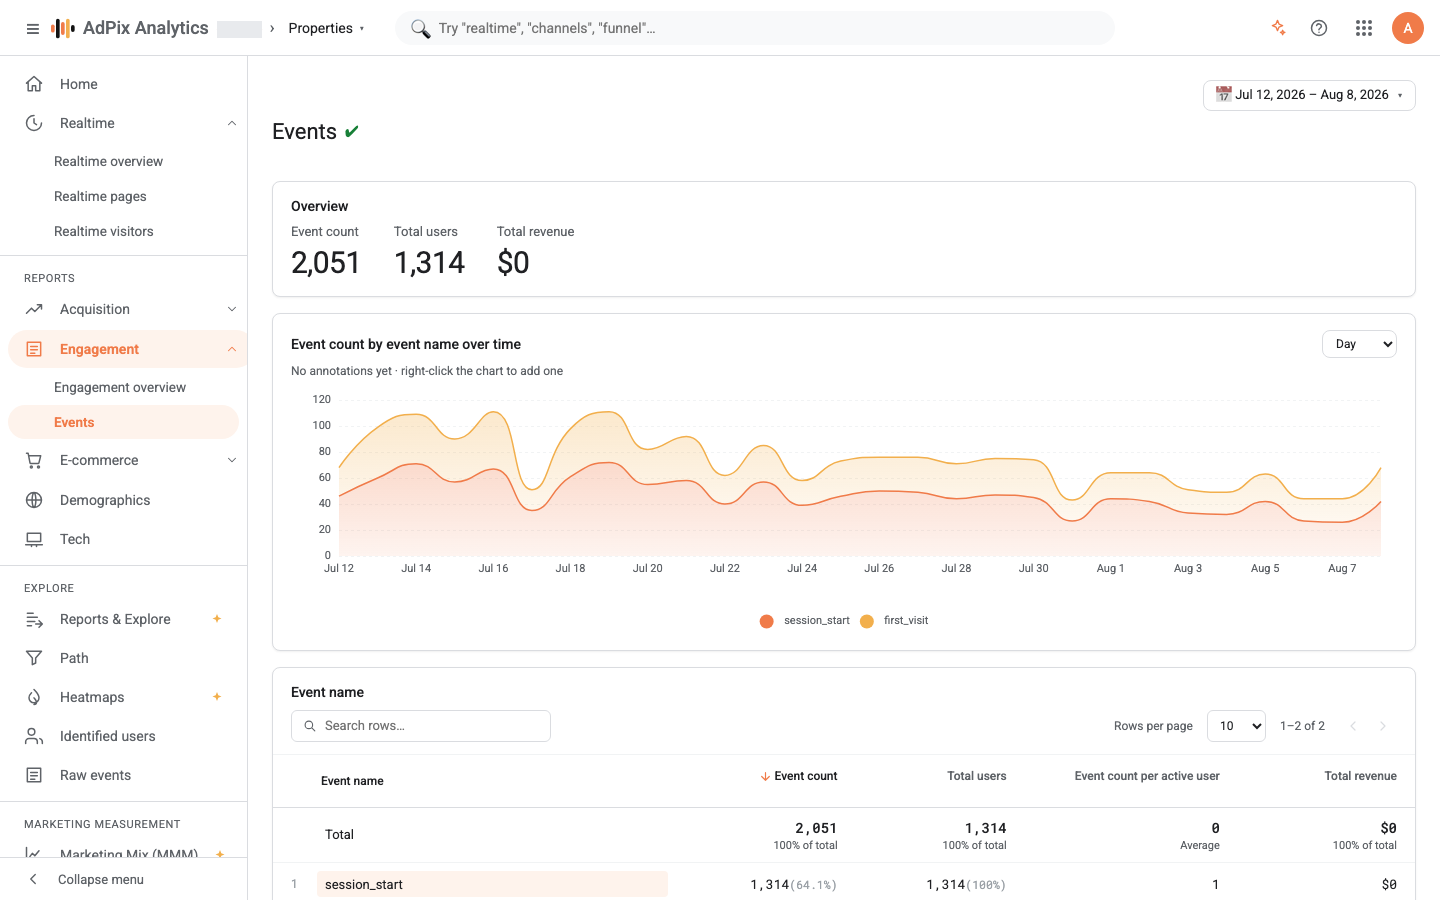
The Total revenue card's value is the raw sum of the value parameter with no currency conversion, but the card renders it behind a fixed currency symbol. If you sell in a single currency the number is right and the symbol beside it is noise. If you take several currencies, the number itself is meaningless: go to the E-commerce report, which carries a per-currency split.
The trend chart and its link to the table#
The chart stacks event counts over time and shows the six busiest events of the range by default. The service returns at most twenty names for the chart, so the long tail of rare events is deliberately left out to keep it readable.
The chart follows the table: while the row search is empty it draws those six; the moment you search in the table, the chart narrows to the events that survived your search. That is the quickest way to see one event's trend — type its name into the search.
Three more controls sit on the page:
- Time grain — day, week or month. Your choice is remembered in that browser and comes back next time.
- Sorting and rows per page — on the column headers and below the table.
- Compare — turn Compare on in the date picker and the same report is computed for the previous period: the cards show the difference and the chart puts the previous series next to the current one.
Where the event names come from#
Every row in this table arrived by one of five paths:
| Path | Example |
|---|---|
| A data stream's enhanced measurement | page view, scroll, outbound click, download, form submit, video, site search |
| A manual tracker call | ap('track', 'demo_requested', { plan: 'pro' }) |
| The e-commerce command | ap('ecommerce', 'purchase', { transaction_id: '10482', value: 4900000, currency: 'IRR', items: [...] }) |
| Create-event and Modify-event rules | an event built at collection time from another event's URL or parameters |
| A server-to-server send | the order your payment gateway posted to your backend, forwarded by you |
All five land in this one table. Server-side events have no browser session and carry no page URL, but they are fully present in the event count and the revenue column — if a number is here and missing from page-based reports, that is usually why.
Nothing here marks an event as important. Which events count as conversions, and how they are counted — once per user or once per session — is decided in key events, and that is what feeds the conversion rate in every other report.
Limits, and what is not in this report#
- 200 rows. The table carries the range's 200 busiest events. If your property generates dynamic event names (a product name baked into the name, say), the tail is cut off. Keep event names stable and put the variables in parameters.
- No secondary dimension. This screen works with the event name only. To break one event down by channel, country or device, use an exploration.
- Parameters do not become columns. Parameters inside an event get no column until they are registered as a custom dimension or metric. The one exception is
value, which is read as the revenue column. - Test-mode traffic is excluded. Events that arrived flagged as test mode are left out of every report, including this one.
When a number looks wrong#
Purchase and purchase are two separate rows.value, or you are sending it as a string. Send a number, not a formatted amount with separators.Frequently asked questions#
Why do page views appear as page_view when we never send an event by that name?
A page view is recorded by event type and its event-name column is empty. The report substitutes the type for those rows so they read as page_view — the same thing the Realtime report does, and the same name you see in GA4.
Why is the event count lower than the number of raw rows?
Because the count is over unique event IDs, not rows. The tracker delivers at least once and may re-send an event after a network failure; the report counts it once. For server-side events, the ID you choose yourself plays that role.
An event I am definitely sending is not in the table. Where do I look?
The table carries only the range's top 200 events by count, so search for its name in the row search first. If it is still missing, the event was not collected in this range at all — statistics consent was not granted, test mode is on, or the event name differs from what you think.
Where does the Total revenue column come from?
From the sum of the value parameter on those events. No currency conversion happens, so if your property takes more than one currency this figure adds unlike units. The per-currency split exists only in the E-commerce report.
Thanks — your feedback helps us improve the docs.