Tech report
Browser, operating system and device category for your visitors. The screen to open before you decide to support — or drop — a browser, and the screen that misleads you if you do not know how coarse its buckets are.
Where the screen is#
In the console menu, under the Reports group, choose Tech. The route is /tech. The page heading is Tech overview and it holds four blocks:
| Block | What it shows |
|---|---|
| Overview | three headline tiles: Users, Sessions, Views |
| Users by device category | a donut of desktop / mobile / tablet |
| Users by browser | a bar chart of browsers |
| Browser and Operating system | two tables with Value, Users, Sessions |
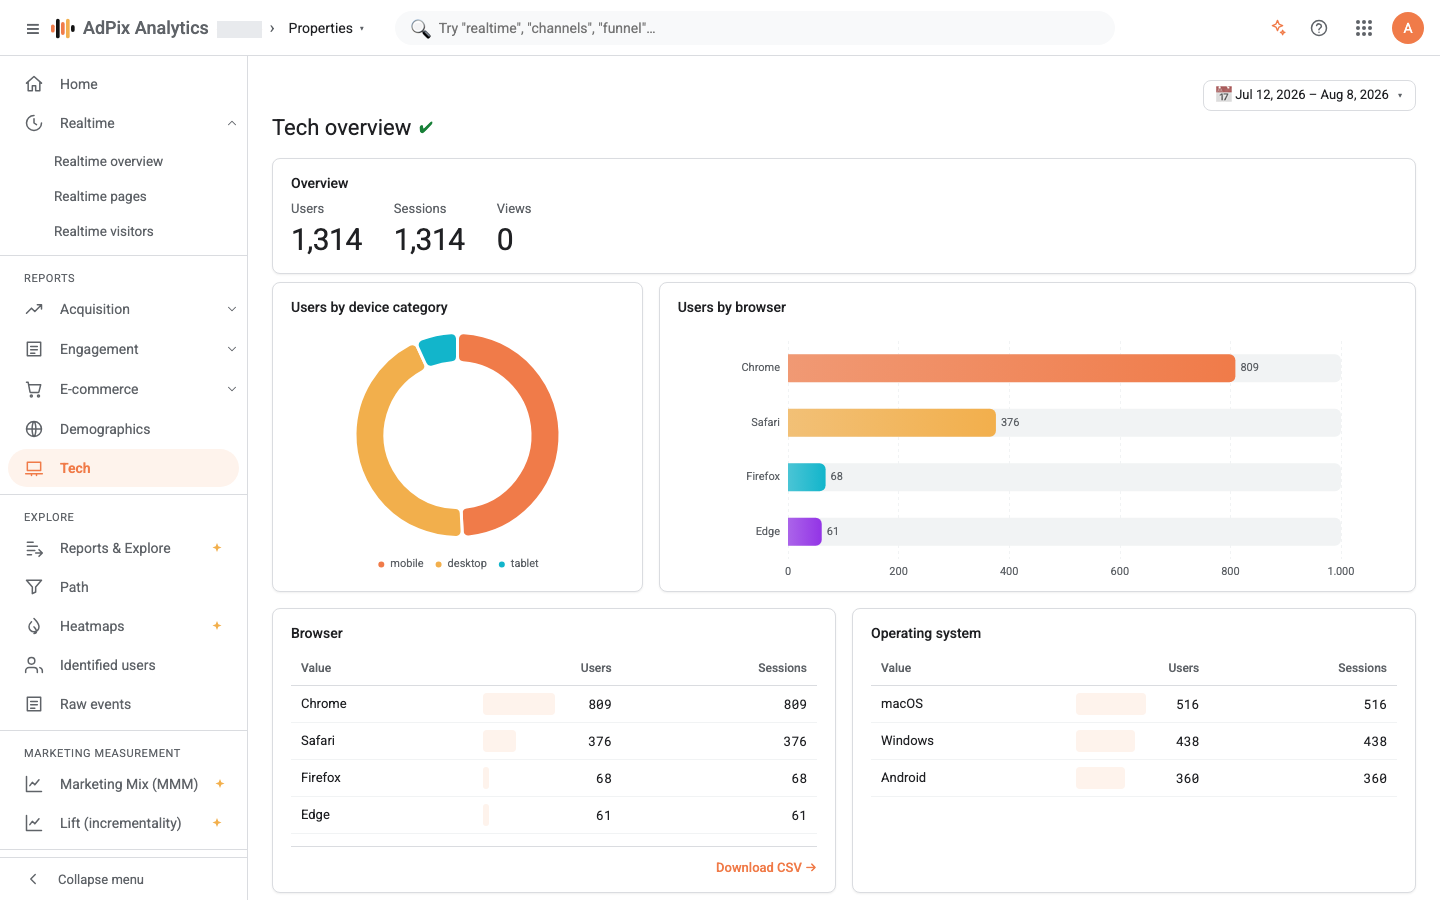
The Download CSV link sits under the Browser table and — contrary to what you would expect — does not export just browsers. That is covered below.
The buckets are deliberately coarse#
This is the most important thing to know about the screen. AdPix does not run the user-agent string through a heavyweight parser; it looks for a handful of known tokens and drops each hit into one of a few buckets. The result is a short, stable list you can compare over time, rather than a hundred rows of half-percent versions.
| Dimension | Possible values |
|---|---|
| Browser | Edge · Chrome · Firefox · Safari · Other |
| Operating system | Windows · macOS · Android · iOS · Linux · Other |
| Device category | mobile · tablet · desktop |
The order the tokens are tested in is part of the behaviour, with several concrete consequences:
- Edge is tested before Chrome, otherwise every Edge visit would land under Chrome.
- Chromium-based browsers — Brave, Opera, Vivaldi, Yandex — all become
Chrome. Their user-agent string carries the Chrome token, and that is what AdPix sees. - On iOS every browser lands under
Safari. Chrome and Firefox on an iPhone use Apple's engine and their strings carry the Safari token; their own product tokens are not on the test list. - Android tablets fall into
mobile. The mobile test runs first and includes the Android token, so any Android device — phone or tablet — counts as mobile. In practicetabletalmost always means iPad.
If you are comparing mobile share, Safari share or the size of "Other" against Google Analytics or anything else, read that tool's definition before concluding anything. A gap on this screen is usually a difference in bucketing, not in collection. For the other reasons numbers diverge, see Numbers don't match GA4.
Each table returns at most 50 rows and drops rows whose value is empty — an event that carried no user agent at all. Given the short value lists above, that cap is never actually reached for browser or operating system.
The three headline numbers#
The usual definitions, and exactly the same numbers you see on the Demographics report:
| Tile | Definition |
|---|---|
| Users | distinct visitor identifiers seen in the selected range |
| Sessions | distinct sessions; an event with no session is not counted |
| Views | page_view events only |
"User" here also means a distinct browser, not a distinct person. Someone arriving on desktop Chrome and mobile Safari fills two rows in the browser table and counts as two users in the headline. That is why you should not sum the user column across rows — these tables exist to be read as proportions.
Both tables carry sessions alongside users. When one browser's sessions-per-user ratio sits noticeably below the rest, that usually points at something breaking in that browser — not at its users being less interested.
What never reaches this screen#
- Bots. User agents recognised as crawlers are separated out before reporting, which is why no search-engine crawler appears in your list.
- Test traffic and the internal IP blocks you listed under Admin → Property details → Traffic filtering.
- Server-side events have no browser; their tech values are only populated when your server-to-server call passes the visitor's user-agent string in
context.
Comparing with a previous period#
Turn Compare on in the date-range picker and all three headline tiles gain a percentage change — green with ▲, red with ▼ — against the same numbers over the second window.
The charts and both tables always reflect the primary range. To see how one browser's share moved between two periods, pull the first range and export it, then the second. The comparison modes are covered in Date ranges and comparison.
CSV export#
This page's export is a cross-tab, not a copy of the browser table: each row is one combination of browser, operating system and device category, with the user count for that combination — up to 5,000 rows, over the range and property selected on screen.
That is exactly what combination questions need: "how many are on Safari on mobile?", "what share of Firefox is on Windows?" — questions the two independent on-screen tables cannot answer.
There is no sessions column in this file, only users. And as with every CSV export here, column order is not guaranteed — resolve columns from the header row, not by position. If the range holds no rows, the file comes back completely empty.
Frequently asked questions#
Why aren't Brave and Opera in the list?
Both are Chromium-based and their user-agent string carries the Chrome token, which is what AdPix classifies on — so both land under Chrome. That is deliberate: the list stays short and stable over time instead of splintering into dozens of sub-percent names.
Why is my mobile share different from Google Analytics?
Because the bucket boundaries differ. In AdPix any user agent carrying the Android token counts as mobile, including Android tablets. A tool that separates tablets puts the same traffic in a different bucket.
What does Other mean in the browser column?
Any browser whose user-agent string carries none of the four known tokens — Edge, Chrome, Firefox, Safari. In-app browsers, Android's stock browser and unusual clients typically collect here.
Why don't the user columns add up across tables?
One visitor can appear on two browsers or two operating systems within the same range and is counted in each matching row. Every table is counted independently — read the proportions, do not sum the columns.
Thanks — your feedback helps us improve the docs.